In the UK, the topic of house prices is never far from a news headline. With a flurry of indices and data sources, it can be a daunting task to keep track of which direction prices are headed. To cut through the fog, we will first shed light on why there are so many different house price reviews, and then delve into the latest actual sales figures from the Office for National Statistics (ONS) UK House Price Index (HPI).
Deciphering the Diversity of House Price Indices
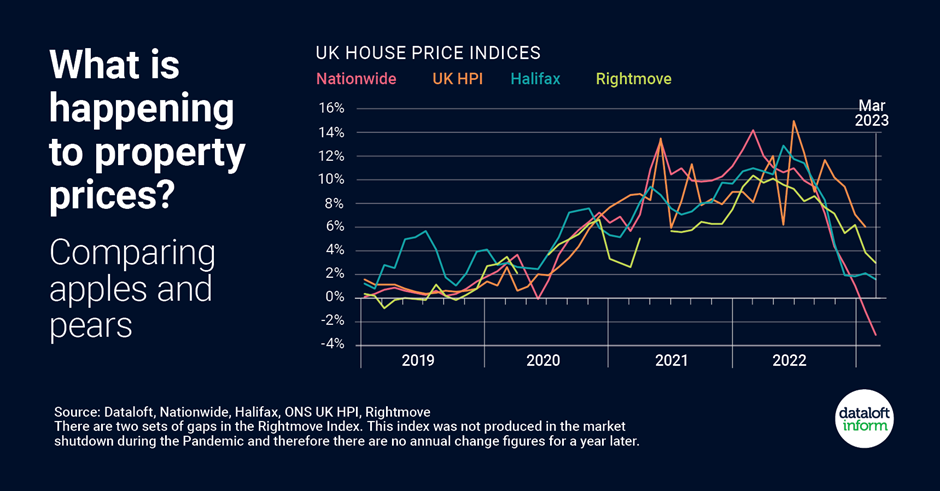
Each house price index in the UK tells a slightly different story, not due to a discrepancy in facts, but because each calculates data in a unique way. This leads to a variety of figures, causing a sense of confusion for many.
Rightmove, for instance, is known for presenting the highest average prices. However, their index is based upon the asking prices of newly listed properties, around 100,000 each month, rather than actual sale prices achieved. On the other hand, the ONS UK HPI uses final sales prices, including for cash and mortgage sales, recorded by the Land Registry. This index covers about 80,000-100,000 sales per month.
Meanwhile, financial institutions like Halifax and Nationwide use their own mortgage applications at the approval stage, totalling around 12,000 -15,000 per month. The average price quoted by Nationwide tends to be the lowest among these indices. The variations in the source of the data and the statistical calculations underpinning each index, account for their differences.
But fear not, despite the differing methodologies, the overall trend direction noted by each organisation tends to align. It is this overall trend, rather than the specific figures, that is most valuable when assessing the current status of the property market.
Reviewing the Current UK House Price Landscape
Moving on to the main point of our article, let’s delve into the latest published UK House Price Index from the Office for National Statistics. Remember, this index details the actual selling price as disclosed to the Land Registry.
The average UK house price increased by 5.5% in the 12 months leading up to February 2023, a deceleration from 6.5% in January 2023. At £288,000, the average house price in February was £16,000 higher than 12 months prior, albeit £5,000 below the recent peak recorded in November 2022.
This marked the third consecutive month of falling average house prices in the UK, on both a seasonally adjusted and a non-seasonally adjusted basis.
In terms of regional averages over the 12 months, England saw house prices increase to £308,000, a rise of 6.0%. In contrast, Wales witnessed average house prices reach £215,000, a 6.4% increase, while Scotland and Northern Ireland saw prices of £180,000 (1.0%) and £175,000 (10.2%) respectively.
Scotland’s annual house price inflation has been on a downward trend since its recent peak of 13.8% in the 12 months leading up to April 2022, slowing to a modest 1.0% in the 12 months to February 2023.
The West Midlands region outperformed all other English regions with the highest annual percentage change (8.6%) in the 12 months to February 2023. In contrast, London saw the lowest growth, with a modest increase of 2.9%.
In summary, the UK housing market is a complex tapestry with regional variations, trends, and fluctuations. Despite the different calculations in various indices, they all tell a similar story of the market’s direction. By understanding these nuances, we can make more informed decisions, whether we are buying, selling, investing, or simply keeping ourselves informed.
Reflecting on the Trends
It’s noteworthy to mention the decline in the average UK house price over the last three months. While some may view this as a cause for concern, it’s important to remember that the property market is cyclical. Periods of rapid growth often give way to slower phases, where prices may stagnate or even fall slightly. However, the overall trend remains positive, with a 5.5% increase in the past 12 months.
The regional differences are also worth mentioning. The robust growth in the West Midlands showcases the region’s rising appeal, perhaps driven by factors such as infrastructure development, increased job opportunities, and favourable property prices compared to other regions. On the flip side, London’s lower growth rate could be attributed to a variety of factors, such as affordability issues or a saturation in certain boroughs.
It is also important to highlight Scotland’s trend, with house price inflation slowing to 1.0% over the past 12 months. This could be due to economic factors, policy changes or local market conditions, but it is a trend worth monitoring.
Looking Ahead
While there are many sources of UK house price information, understanding the methodologies behind each can help us make sense of the figures and identify the consistent trends. The current market shows a general upwards trend, despite recent monthly falls in the average price, with regional variations that offer unique opportunities for home buyers, sellers, and investors.
As we look towards the future, we’ll continue to monitor these trends and provide insights that help you navigate the ever-evolving property landscape. After all, whether it’s a castle in Scotland, a terrace in Wales, a flat in London, or a semi-detached in the Midlands, the UK housing market remains one of the most dynamic and diverse in the world and we are here to help guide you through it.
Sources: